Day 14: Make PowerPoint Charts Accessible
Using Charts in PowerPoint is a popular way to convey data. When we include alt text, we ensure everyone can access this important visual information.
When adding alt text to a chart in your presentation:
- Do not use auto-generated descriptions because they will not provide sufficiently informative descriptions for users of screen readers.
- Instead, write your own descriptive but concise alt text.
- Explain key visual elements.
- Summarize the chart, including key data points.
- Craft your alt text in a word processor to catch typos and grammatical errors.
Follow these instructions to add alt text to a chart in PowerPoint:
- Navigate to a chart within your presentation.
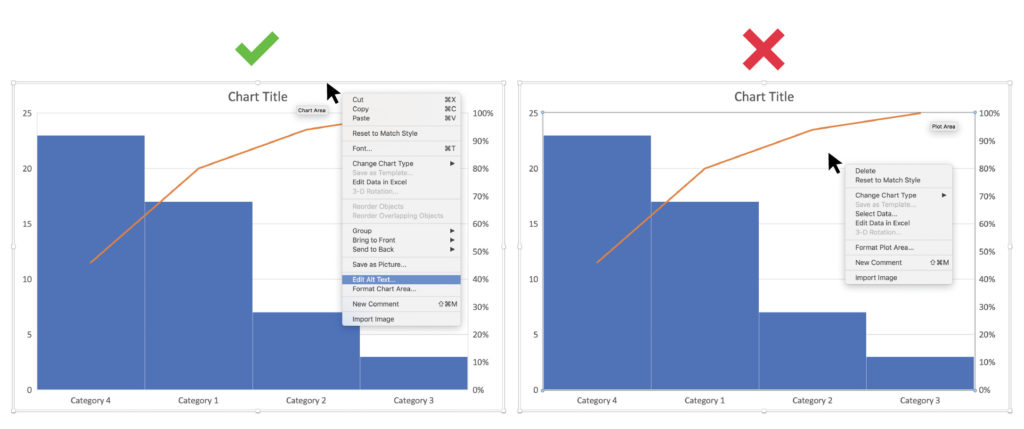
- Select the chart and right click or use the key combination, “Shift” + “F10.”
- A drop-down menu will appear.
- Within the drop-down menu, select “Edit Alt Text.”
- A dialogue box will open.
- Input your alt text.
If you found today’s challenge useful, let us know by tagging #ABD21DayChallenge and #AccessibleByDesign.